Ecommerce Return Rate: What Apparel Sellers Need to Know in 2026
What is a good return rate for ecommerce? Here you can learn about ecommerce return rate, vary by category, the causes of high returns, and how can you reduce it with proven strategies.


Ecommerce returns are one of the most troublesome things for apparel sellers. Every return erases your margin on that sale, and some items come back unsellable. You're not alone: apparel consistently has the highest return rate of any ecommerce category, and the numbers keep climbing.
But beneath the headline statistics, most apparel returns stem from expectation gaps—especially around size, fit, and visual appearance — how you photograph clothes and represent them. The customer expected the garment to look one way based on your product images — and when it arrived, reality didn't match. Closing that expectation gap is one of the most effective return-reduction strategies available.
This article breaks down the latest ecommerce return rate data, explains what returns actually cost your business, and lays out six practical strategies to bring your numbers down — starting with the factor that causes the most returns and gets the least attention.
Key Takeaways
Apparel return rates are 20–40% — the highest of any ecommerce category, with some fashion segments exceeding 50%. The overall ecommerce average sits around 19–20%.
Returns cost $10–$65 per item in processing, shipping, inspection, and markdowns. Only 48% of returned items resell at full price. At scale, this erodes margins fast.
Poor visual representation is one of the largest preventable causes of apparel returns. When product images don't accurately show fit, fabric, and how the garment looks on a body, customers return what doesn't match their expectations.
Better product visuals can cut return rates measurably. Detailed model try-ons, video showing fabric movement, and diverse model representation all reduce the "didn't look like the photo" return reason.
A "good" return rate depends on your category. For apparel, anything under 25% is strong; under 20% is excellent. For beauty, aim below 10%. Benchmark against your vertical, not the cross-category average.
Start here: Audit your product images first — it's the highest-impact, lowest-friction strategy. Then layer in sizing data, video, and return analytics.
What Exactly Ecommerce Return Rate Is? The Numbers
Let's start with the big picture. U.S. retail returns totaled $849.9 billion in 2025, representing 15.8% of annual sales. That's a slight decline from $890 billion (16.9%) in 2024 — the first year-over-year drop since 2020, driven partly by more retailers charging return fees.
But those aggregate numbers include brick-and-mortar returns, which average just 5–9%. Ecommerce return rates are roughly 2–3x higher, averaging 19–20.8% across all categories. And for apparel specifically, the numbers are steeper:
| Channel | Average Return Rate |
| Brick-and-mortar (all categories) | 5–9% |
| Ecommerce (all categories) | 19–21% |
| Ecommerce apparel & fashion | 20–40% |
| Some fashion sub-segments | Up to 50% |
Global ecommerce returns are projected to exceed $640 billion annually, with some forecasts suggesting the figure could approach $1 trillion within the decade. For apparel sellers, this isn't a minor operational cost — it's a strategic problem that directly determines whether your business is profitable at scale.
How Return Rates Vary by Category
Apparel doesn't just have high returns — it consistently tops every category ranking. Here's how the numbers break down:
| Category | Return Rate Range |
| Apparel & fashion | 20–40% (up to 50% in some segments) |
| Footwear | 17–30% |
| Luxury goods | 18–30% |
| Home goods & furniture | 15–23% |
| Jewelry & accessories | 10–15% |
| Consumer electronics | 8–15% |
| Pet products | 8–12% |
| Beauty & cosmetics | 4–12% |
| Supplements & health | 5–10% |
| Food & grocery | 5–12% |
In 2025, 26% of U.S. consumers who bought clothing online returned at least one item. Apparel returns aren't primarily about quality defects—they're about information gaps. The customer simply didn't have enough accurate information to make the right purchase decision. Let's look at what the data actually says about these root causes.
Why Are Apparel Returns So High? The Root Causes
Based on return reason data across the apparel ecommerce industry, the causes cluster into five categories:
Size and fit issues (40–50% of apparel returns). The garment doesn't fit as expected. This is the dominant return reason — and it's almost entirely preventable with better information.
Visual misrepresentation (20–30% of apparel returns). The product looks different in person — color, fabric texture, drape, or detailing doesn't match the product images. This is the second-largest category and the one most directly under seller control.
Quality concerns (10–15%). Fabric quality, stitching, or construction doesn't meet expectations set by the price point or marketing.
Changed mind / bracketing (10–15%). The customer ordered multiple options intending to keep one. This behavior has increased with free returns policies.
Damaged in transit (5–10%). Packaging failure leads to damaged goods.
The pattern is clear: 60–80% of apparel returns trace back to the information gap between what the customer expected and what they received. And the primary medium for setting expectations — before the package arrives — is your product imagery.
6 Proven Strategies to Reduce Your Ecommerce Returns
Strategy 1: Upgrade Your Product Visuals — Show the Garment, Not Just a Photo
This is the highest-impact, lowest-friction strategy — and the one most sellers underinvest in. Your product images are the customer's entire basis for forming expectations. When those images don't accurately represent the garment, returns are inevitable.
What effective visual assets include:
On-model try-on shots on diverse body types. Show the same garment on models of different sizes, body shapes, and skin tones. A customer who sees someone with a similar body type wearing the garment is far less likely to be surprised when it arrives.
Fabric detail close-ups. Zoom in on the material — the weave, the texture, the weight. A customer who can see the fabric clearly knows what to expect.
Multiple angles. Front, back, side, and detail shots. The more views, the fewer surprises.
Preserve the garment appearance. Shoot in consistent lighting; avoid heavy color grading that changes how the garment actually looks.
For sellers who can't afford traditional model photoshoots for every SKU — which is most small and mid-sized apparel businesses — AI visual production platforms like Koozee now make this practical. You can upload a simple flat-lay or mannequin photo and generate on-model try-on visuals with diverse body types, poses, and scenes.
If you sell lingerie, swimwear, or bodycon dresses, Koozee also has a dedicated try-on workflow for intimate apparel, allowing you to show exactly how these tricky garments stretch and drape on a real body, setting accurate expectations before the customer buys.
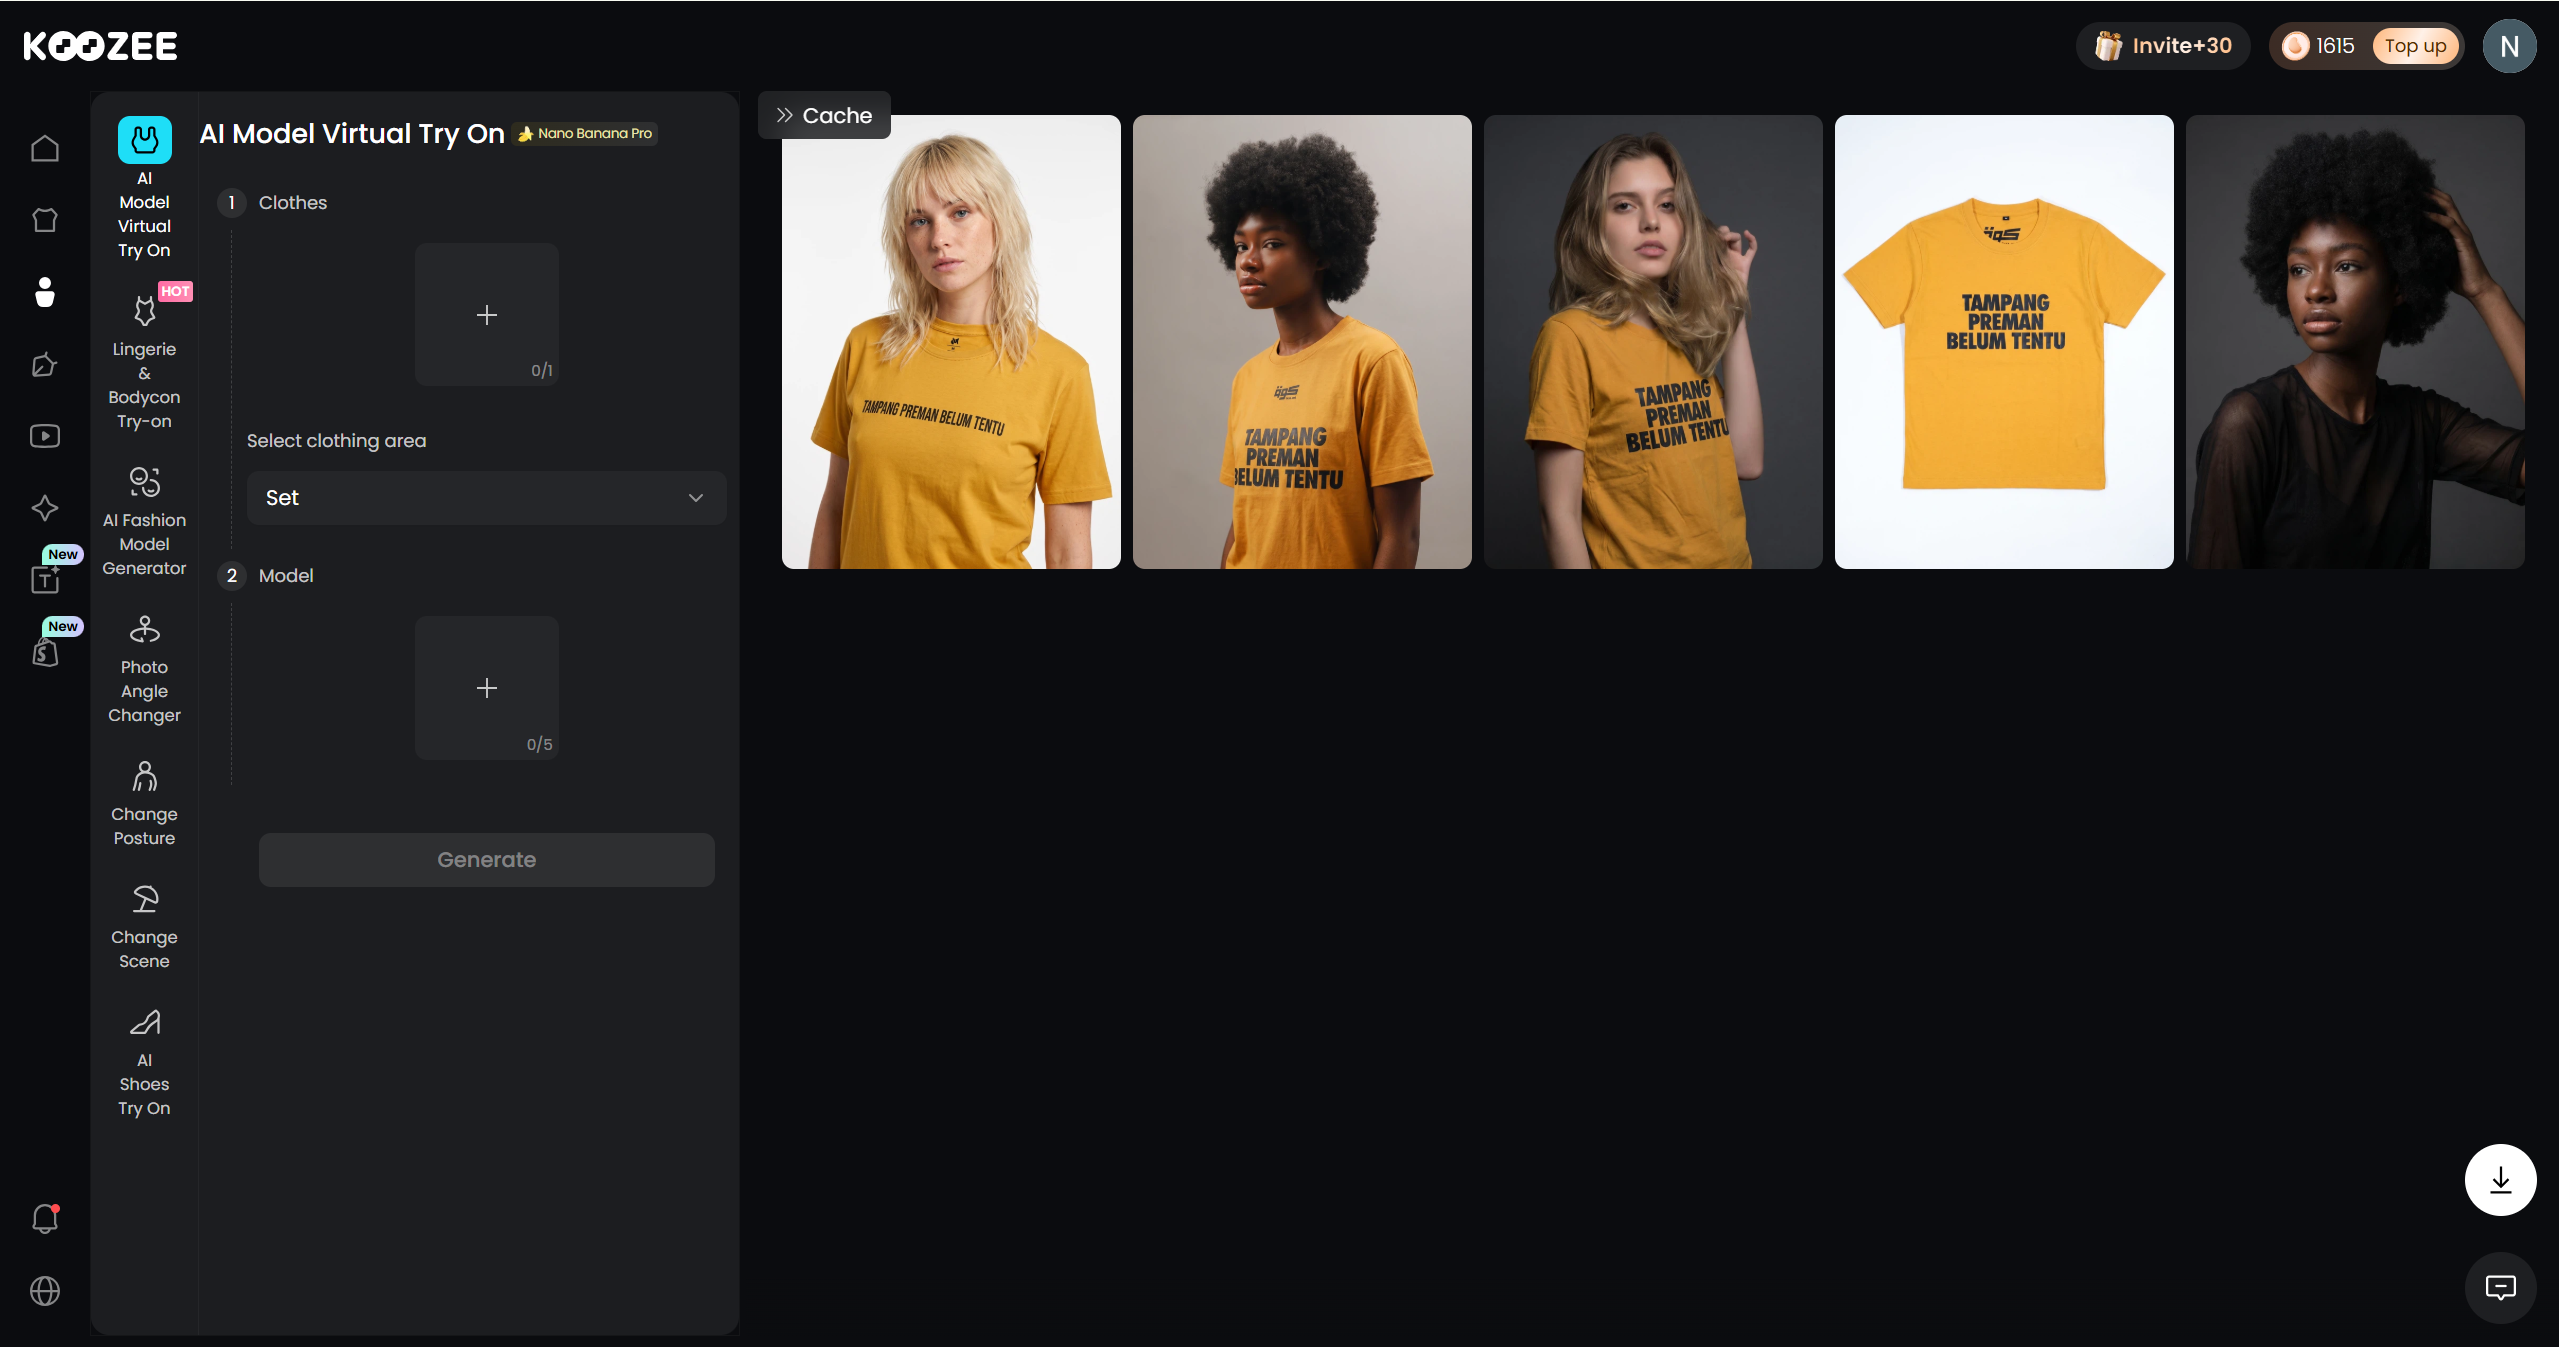
From one product photo, you can create:
On-model images across multiple body types, ages, and skin tones — so customers see the garment on someone who looks like them
Fabric detail close-ups that represent texture and weight
Product videos showing the garment in motion — walking, turning, draping
Scene variations (studio, street, outdoor) that show the garment in context
For Shopify sellers, Koozee acts as a connected apparel image and video workspace. You simply connect your Shopify store, choose a product, and reuse your existing product images. From there, you can generate variations, preview the results, and manually publish the approved assets right back to your Shopify listing.
The result isn't just better-looking product pages. It's lower return rates — because customers see what they're actually buying, on a body type that's relevant to them, before they click "add to cart."
Strategy 2: Add Detailed Sizing Information — and Make It Specific
"True to size" is the most useless phrase in ecommerce. It communicates nothing because "size" means something different to every brand. Replace vague language with specific data.
What works:
Garment measurements, not just body measurements. List the actual dimensions of the garment — chest width, sleeve length, shoulder-to-hem — for each size. This is more useful to customers than a generic size chart.
Model measurements. When showing on-model images, list the model's height, bust/chest, waist, and hip measurements, plus the size they're wearing. This gives customers a concrete reference point.
Fit notes. Is this garment designed to be fitted, relaxed, or oversized? Does the fabric have stretch? These details matter more than the size label.
Customer fit feedback. Aggregate and display fit data from previous buyers: "72% of customers say this fits true to size; 18% say it runs small."
Strategy 3: Use Video to Set Accurate Expectations
Static images can't show how fabric moves, drapes, or catches light. Video can. And the data supports it: product pages with video see measurably lower return rates in apparel categories because customers have a more complete expectation of what they're buying.
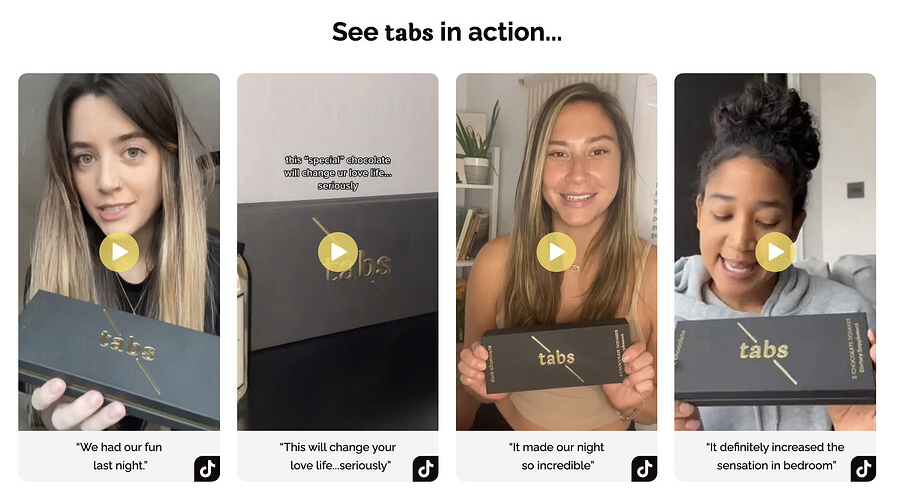
What to show in product video:
The garment in motion. A model walking, turning, and moving naturally in the clothing. This answers the questions photos can't: How does the fabric flow? Does it wrinkle? How does it look from every angle?
Close-up fabric handling. Show someone touching, stretching, and draping the fabric so customers understand the material quality.
Fit on different body types. If possible, show the same garment on two different models — this dramatically reduces the "it didn't look like that on me" return reason.
For sellers without in-house video production, you can also use Koozee to turn your existing still images into dynamic video content. With a few clicks, you can generate dynamic lookbooks, fit check, and OOTD videos, even tailored for TikTok or Instagram Reels. Showing the garment in motion is one of the fastest ways to help shoppers check the clothes online and stop returns before they happen.
Strategy 4: Analyze Your Return Data Systematically
Most sellers know their overall return rate but haven't dug into the patterns. Return data contains the blueprint for reduction — if you analyze it properly.
What to track:
Return rate by SKU. Which specific products have the highest return rates? Often, it's not the category — it's 2–3 specific items driving your average up.
Return reasons by product. Are customers returning Item A for sizing and Item B for color mismatch? Different problems need different solutions.
Return rate by customer segment. New customers vs. repeat customers? Mobile shoppers vs. desktop? Different segments may need different visual or informational support.
Return timing. Returns within 2–3 days often signal expectation mismatch (they opened the package and it wasn't what they expected). Returns after 2–3 weeks more often signal quality or durability issues.
Once you identify the pattern, target your intervention: if sizing is the issue, add measurements. If color is the issue, audit your photo editing. If a specific SKU is the problem, reshoot or improve its visuals.
Strategy 5: Optimize Your Return and Exchange Policy
This isn't about making returns harder — it's about making exchanges easier than refunds, and using policy design to reduce the behaviors that inflate your return rate.
Tactics that work:
Make exchanges frictionless. When a customer initiates a return for sizing, make the exchange for a different size the default path — pre-fill the exchange form, waive exchange shipping, or offer a small incentive for exchanging instead of refunding.
Offer store credit with a bonus. "Return for a refund, or get 110% back as store credit." This retains revenue and often satisfies the customer more than a straight refund.
Consider return fees — strategically. The data shows return fees reduce return rates. But they also reduce conversion. The balance: offer free returns for exchanges (encouraging the behavior you want) and a modest fee for refunds (discouraging bracketing without punishing genuine issues).
Extend the return window for exchange. A 60-day exchange window alongside a 30-day refund window nudges customers toward the outcome that preserves your revenue.
Strategy 6: Improve Packaging and Quality Control
Returns from transit damage are the most frustrating kind — the customer wanted the product, and you lost the sale to a shipping problem. These are almost entirely preventable.
What works:
Upgrade packaging for fragile or high-value items. The marginal cost of better packaging is almost always less than the cost of a single return.
Add a quality check before shipping. A quick once-over — correct item, correct size, no visible defects — catches issues before they become returns.
Include care instructions in the package. A simple card explaining how to wash, store, or wear the garment reduces post-purchase issues that lead to returns weeks later.
What Is a Good Return Rate for Apparel Ecommerce?
There's no single number that defines "good" across all categories. But here's a practical framework:
| Category | Excellent | Average | Problematic |
| Apparel & fashion | Below 20% | 20–30% | Above 35% |
| Footwear | Below 15% | 15–25% | Above 30% |
| Beauty & cosmetics | Below 5% | 5–10% | Above 12% |
| Consumer electronics | Below 6% | 8–12% | Above 15% |
| Home goods | Below 10% | 15–20% | Above 25% |
For apparel specifically: if your return rate is under 20%, you're performing well above average. Between 20–30%, you're in the normal range — but there's room for significant improvement. Above 35%, returns are likely eroding your profitability, and investigating the root causes should be a priority.
The most useful benchmark isn't the industry average — it's your own trend line. A return rate that was 30% last quarter and 28% this quarter is heading in the right direction, even if both numbers are above the category average.
📌 Note: "Good returning customer rate" (repeat purchase rate) is a different metric from return rate. A healthy repeat purchase rate for ecommerce is 20–30%. If your return rate and your repeat purchase rate are both high, customers may be returning items but still trusting your brand enough to buy again — which is a better signal than a low return rate paired with a low repeat rate.
FAQs about Ecommerce Return Rate
What is the difference among return rate, refund rate, and exchange rate?
Your return rate measures total items sent back divided by total items sold. Refund rate tracks returns that resulted in a full refund (revenue lost), while exchange rate tracks returns swapped for a different size/color (revenue retained). Smart sellers focus on lowering the refund rate by making exchanges frictionless.
What is the average ecommerce return rate?
The average ecommerce return rate across all categories is 19–20.8% as of 2026. However, this varies dramatically by category — apparel averages 20–40%, while beauty averages 4–12% and consumer electronics 8–15%.
How much does each return really costs?
Processing a single ecommerce return typically costs 10–65 per item. This includes reverse shipping, labor for inspection, repackaging, and markdowns for items that cannot be resold at full price.
How can I reduce product returns in my apparel store?
Focus on improving product visuals (adding diverse AI models and video), adding exact garment measurements, and optimizing your policy to favor exchanges over refunds. Better on-page visuals deliver the highest ROI because visual misrepresentation and sizing account for up to 80% of apparel returns.
What is a good returning customer rate for ecommerce?
A healthy repeat purchase rate is 20–30%. A high return rate paired with a high repeat purchase rate indicates that customers still trust your brand despite sizing issues, which is a stronger signal than a low return rate alone.
Why is the apparel return rate so much higher than other categories?
Apparel suffers from three unique challenges: fit uncertainty (customers guessing their size), visual expectation gaps (static photos failing to show fabric drape), and bracketing (customers ordering multiple sizes to return the ones that don't fit).
Do return fees actually reduce return rates?
Yes, charging return fees measurably drops return rates. However, it can also hurt conversion. A balanced approach is to offer free exchanges (retaining revenue) while charging a small fee for full refunds.
Can better product images really reduce returns?
Absolutely. When customers see a garment of diverse body types and in motion, the "didn't look like the photo" return reason drops significantly. Upgrading your visual assets is the highest-impact change you can make to lower expectation-based returns.
You May Be Interested

What Exactly is Ecommerce Localization: Benefits & How-To Guide

Reduce Return Rates E-commerce: 8 Strategies for Fashion Sellers

How to Turn Flat Lay Into Model: 3 Methods for Clothing Sellers
